طلای 18 عیار گرمی دومین افت روزانه متوالی را تجربه کرد
طلای 18 عیار گرمی در ۳ مرداد ۱۴۰۵ افت محسوسی ثبت کرد و در 182,550,000 ریال بسته شد.
خلاصه بازار
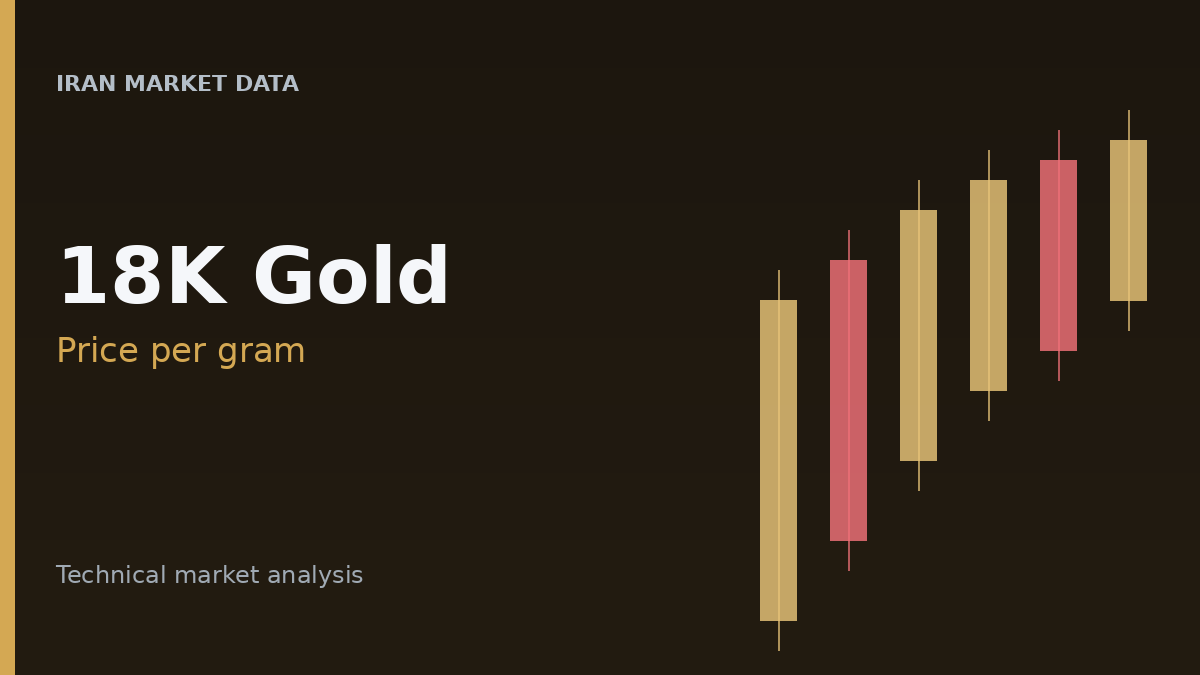
طلای 18 عیار گرمی در ۳ مرداد ۱۴۰۵ افت محسوسی ثبت کرد و در 182,550,000 ریال بسته شد. معاملات از سقف روزانه 188,566,000 ریال آغاز شد که فشار نزولی فوری را نشان میداد و سپس قیمت تا کف 182,245,000 ریال کاهش یافت. این دومین روز زیان متوالی این فلز گرانبها بود.
تحلیل بازار
آخرین روز معاملاتی طلای 18 عیار گرمی با افت چشمگیر درونروزی همراه بود و قیمت نزدیک کف روزانه بسته شد. این حرکت پس از روند صعودی اوایل تیر رخ داد که قیمت را در ۲۷ تیر ۱۴۰۵ به سقف اخیر 191,382,000 ریال رساند؛ سطحی که اکنون مقاومت محسوب میشود. با وجود عقبنشینی دو روزه، ساختار کلی بازار همچنان «صعودی» است. قیمت فعلی بالاتر از میانگینهای متحرک ساده 20، 50 و 200 روزه بهترتیب در 180,855,650، 176,363,496 و 172,249,034 ریال معامله میشود و با هر دو اوج و کف 52 هفتهای فاصله زیادی دارد.
نکات تکنیکال
پس از حرکت اخیر قیمت، شاخصهای مومنتوم تصویری متفمرداد دارند. RSI در 52.84 قرار دارد و بدون نشانه اشباع خرید، مومنتوم نسبتاً مثبت را نشان میدهد. خط MACD بالاتر از خط سیگنال و هیستوگرام آن مثبت است که معمولاً به مومنتوم صعودی اشاره دارد.
ADX در 26.31 وجود روند را نشان میدهد و +DI در 31.97 بالاتر از -DI در 24.22 است؛ بنابراین خریداران همچنان کنترل روند غالب را در دست دارند. با این حال، سایر شاخصها افت اخیر را منعکس میکنند. PSAR بالاتر از قیمت قرار دارد و جهت آن روند نزولی کوتاهمدت را نشان میدهد. Aroon Oscillator نیز در -75.0، همراه با Aroon Down در 100.0 و Aroon Up در 25.0، برتری قدرتمند روند نزولی اخیر را نشان میدهد.
جمعبندی
طلای 18 عیار گرمی در ۳ مرداد ۱۴۰۵ دومین افت روزانه متوالی را تجربه کرد و نزدیک کف روزانه بسته شد. ساختار گستردهتر بازار به پشتوانه معامله قیمت بالاتر از میانگینهای متحرک کلیدی همچنان صعودی است، اما Aroon Oscillator و PSAR از تمایل نزولی کوتاهمدت خبر میدهند. دادههای موجود بازار بهتنهایی علت بنیادی این حرکت قیمت را مشخص نمیکنند.
نرخهای زنده
آخرین معاملات طلای 18 عیار گرمی را در پرایس۳۶۰ دنبال کنید.