عقبنشینی دلار بازار آزاد (USD/IRR) با تداوم روند صعودی
دلار آمریکا در بازار آزاد (USD/IRR) در ۸ مرداد ۱۴۰۵ کاهش یافت و در 1,924,000 ریال بسته شد.
خلاصه بازار
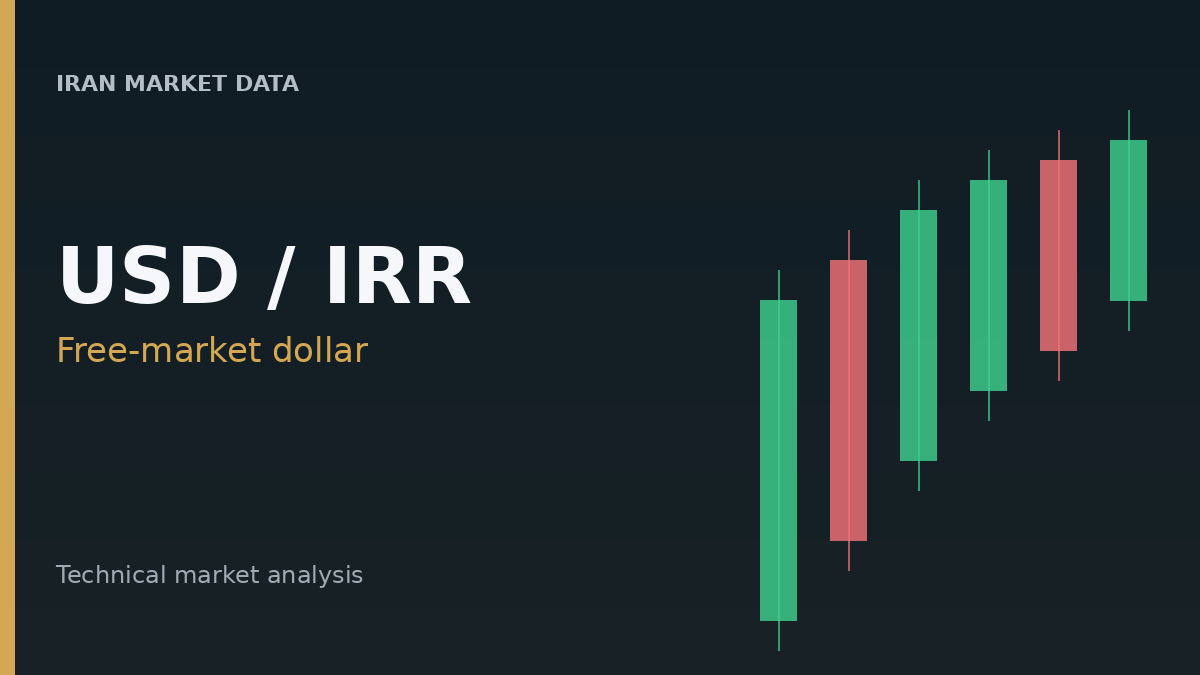
دلار آمریکا در بازار آزاد (USD/IRR) در ۸ مرداد ۱۴۰۵ پایینتر بسته شد و به 1,924,000 ریال رسید. این رقم نسبت به قیمت بازگشایی 1,935,850 ریال کاهش داشت و رشته سهروزه رشد را متوقف کرد. قیمت طی روز تا سقف 1,936,200 ریال پیش رفت و سپس عقب نشست.
تحلیل بازار
روز معاملاتی USD/IRR با رشد اولیه و سپس عقبنشینی قابلتوجه همراه بود. قیمت از 1,935,850 ریال آغاز شد و تا سقف روزانه 1,936,200 ریال بالا رفت، اما پس از آن تا کف 1,920,800 ریال کاهش یافت و در 1,924,000 ریال بسته شد؛ حرکتی که عقبنشینی محسوسی از اوج روز را نشان میدهد.
با وجود افت روزانه، ساختار گستردهتر بازار USD/IRR همچنان صعودی است. قیمت بالاتر از میانگینهای متحرک ساده 20، 50 و 200روزه (SMA) معامله میشود و مسیر رو به بالای هفتههای اخیر را تأیید میکند. فاصله قیمت تا سقف 52هفتهای حدود 1.34% است و 81.54% بالاتر از کف 52هفتهای قرار دارد. نوسانپذیری 30 روز گذشته نیز در سطح متوسط 1.51% بوده است.
نکات تکنیکال
قدرت روند: ADX در 26.41 از وجود روند در بازار حکایت دارد. +DI در 36.07 بهطور محسوسی بالاتر از -DI در 22.86 است و غلبه جهت صعودی را نشان میدهد. Supertrend نیز با معامله قیمت بالاتر از سطح 1,833,307.66 ریال، روند صعودی را تأیید میکند.
شاخصهای مومنتوم: RSI در 61.53 مومنتوم مثبت را نشان میدهد، اما هیستوگرام MACD در -2,062.54 منفی است و از تضعیف مومنتوم صعودی یا تقاطع نزولی احتمالی حکایت دارد. Aroon Oscillator در -58.33 نیز قدرت اخیر روند نزولی را نشان میدهد.
سیگنال بازگشت: PSAR در حال حاضر بالاتر از قیمت قرار دارد و جهت آن از احتمال بازگشت کوتاهمدت در روند صعودی غالب حکایت میکند.
جمعبندی
دلار آمریکا در بازار آزاد (USD/IRR) در ۸ مرداد ۱۴۰۵ افت روزانهای را تجربه کرد و رشته رشدهای اخیر متوقف شد. با وجود این عقبنشینی، ساختار گستردهتر بازار و چند شاخص کلیدی همچنان روندی صعودی را نشان میدهند. با این حال، برخی شاخصهای مومنتوم و PSAR از تضعیف احتمالی فشار صعودی کوتاهمدت حکایت دارند. دادههای موجود بازار بهتنهایی علت بنیادی این حرکت قیمت را مشخص نمیکنند.
نرخهای زنده
آخرین وضعیت معاملات دلار آمریکا در بازار آزاد (USD/IRR) را در پرایس۳۶۰ دنبال کنید.